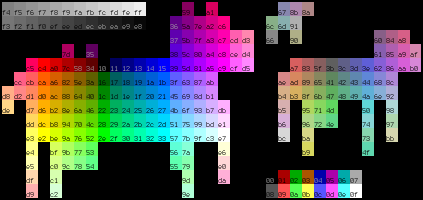
For pyrf I needed to take data from a frequency plot, which could be any number of points, and present it as a spectrogram that fills the view size exactly. In the spectrogram I only care about the maximum values that appear in the range of frequencies represented by each pixel.
If I could just divide the number of source bins by an integer factor the solution would be simple:
return np.amax(data.reshape((-1, factor)), axis=1)
But I have to be able to handle any number of source bins and output that to any number of pixels.
Fortunately numpy is awesome.